

CASE STUDY / RESEARCH REPORT DESIGN
Turning an Excel File Into a Publication
NCAN • MOVING THE COLLEGE ACCESS NEEDLE • PRINT + DIGITAL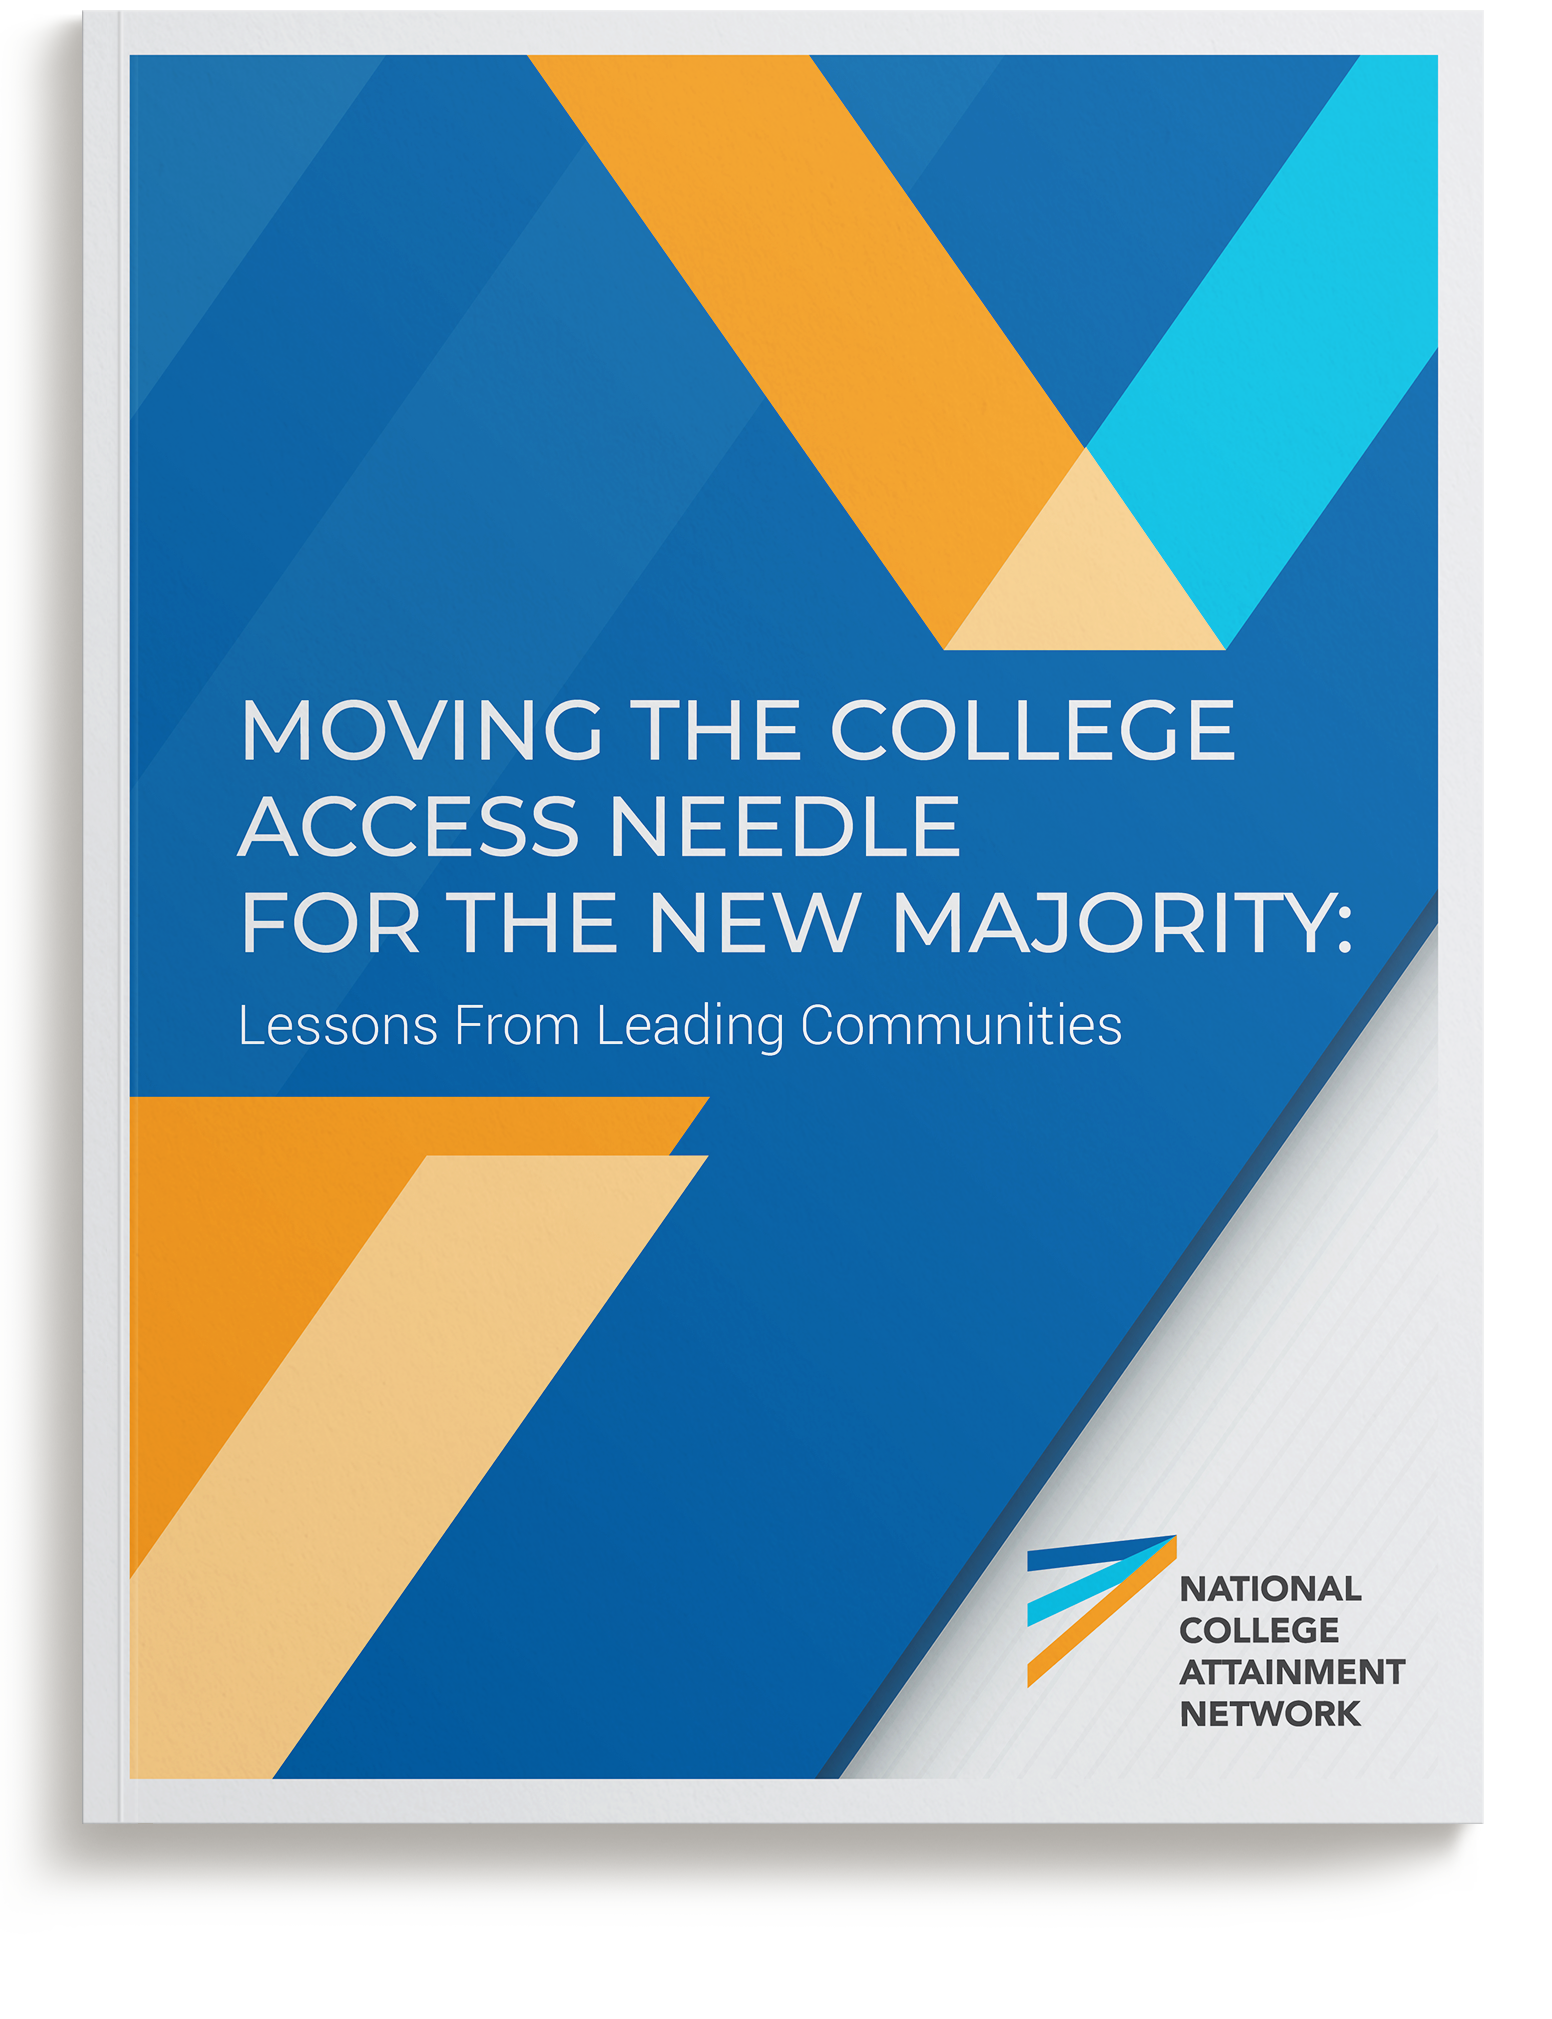
The cover. The client's logo, zoomed and rebuilt: angled lines forming new shapes that frame the title, with no decoration required.
THE PROBLEM
The client arrived with a chapter-based report on college attainment for the new majority and an Excel file of graphics that were doing the data no favors. The task: turn a well-structured but visually flat manuscript into a report that would carry the mission to readers and hold up as a promotional asset afterward.
THE APPROACH
The cover came from the client's own logo. We zoomed into its angled, connected lines and rebuilt them into new shapes that frame the report title, so the brand is the design rather than a sticker on it. The chapter openers carry that same angled system full bleed, giving readers visual rest stops and making the report's structure legible at a flip, while the interior pages are color-coded by section so a reader always knows where they are. All five Excel graphics were rebuilt in Illustrator as user-friendly, on-brand visuals sized to double as social media assets, and stock photography was curated to balance the pages within the client's budget.
THE OUTCOME
The rebuilt graphics went on to carry the report's rollout across social platforms. The report itself traveled well past NCAN: distributed by the Carnegie Corporation of New York, FourPoint Education Partners, and the U.S. Department of Education's ERIC database, and reinforced at launch by two companion articles and a national webinar featuring district practitioners.
5 Graphics
REBUILT FROM EXCEL INTO ON-BRAND, SOCIAL-READY VISUALS
Brand-Led Cover
ANGLED CHAPTER STARTS THAT MAKE THE STRUCTURE VISIBLE AT A FLIP
Ahead of Schedule
DELIVERED EARLY ON A NONPROFIT TIMELINE
Chapter-Based
THE CLIENT'S OWN LOGO ZOOMED AND REBUILT INTO THE TITLE FRAME
Scope also included: cover design, interior layout, concept development, creative direction, infographic design, and photo editing.
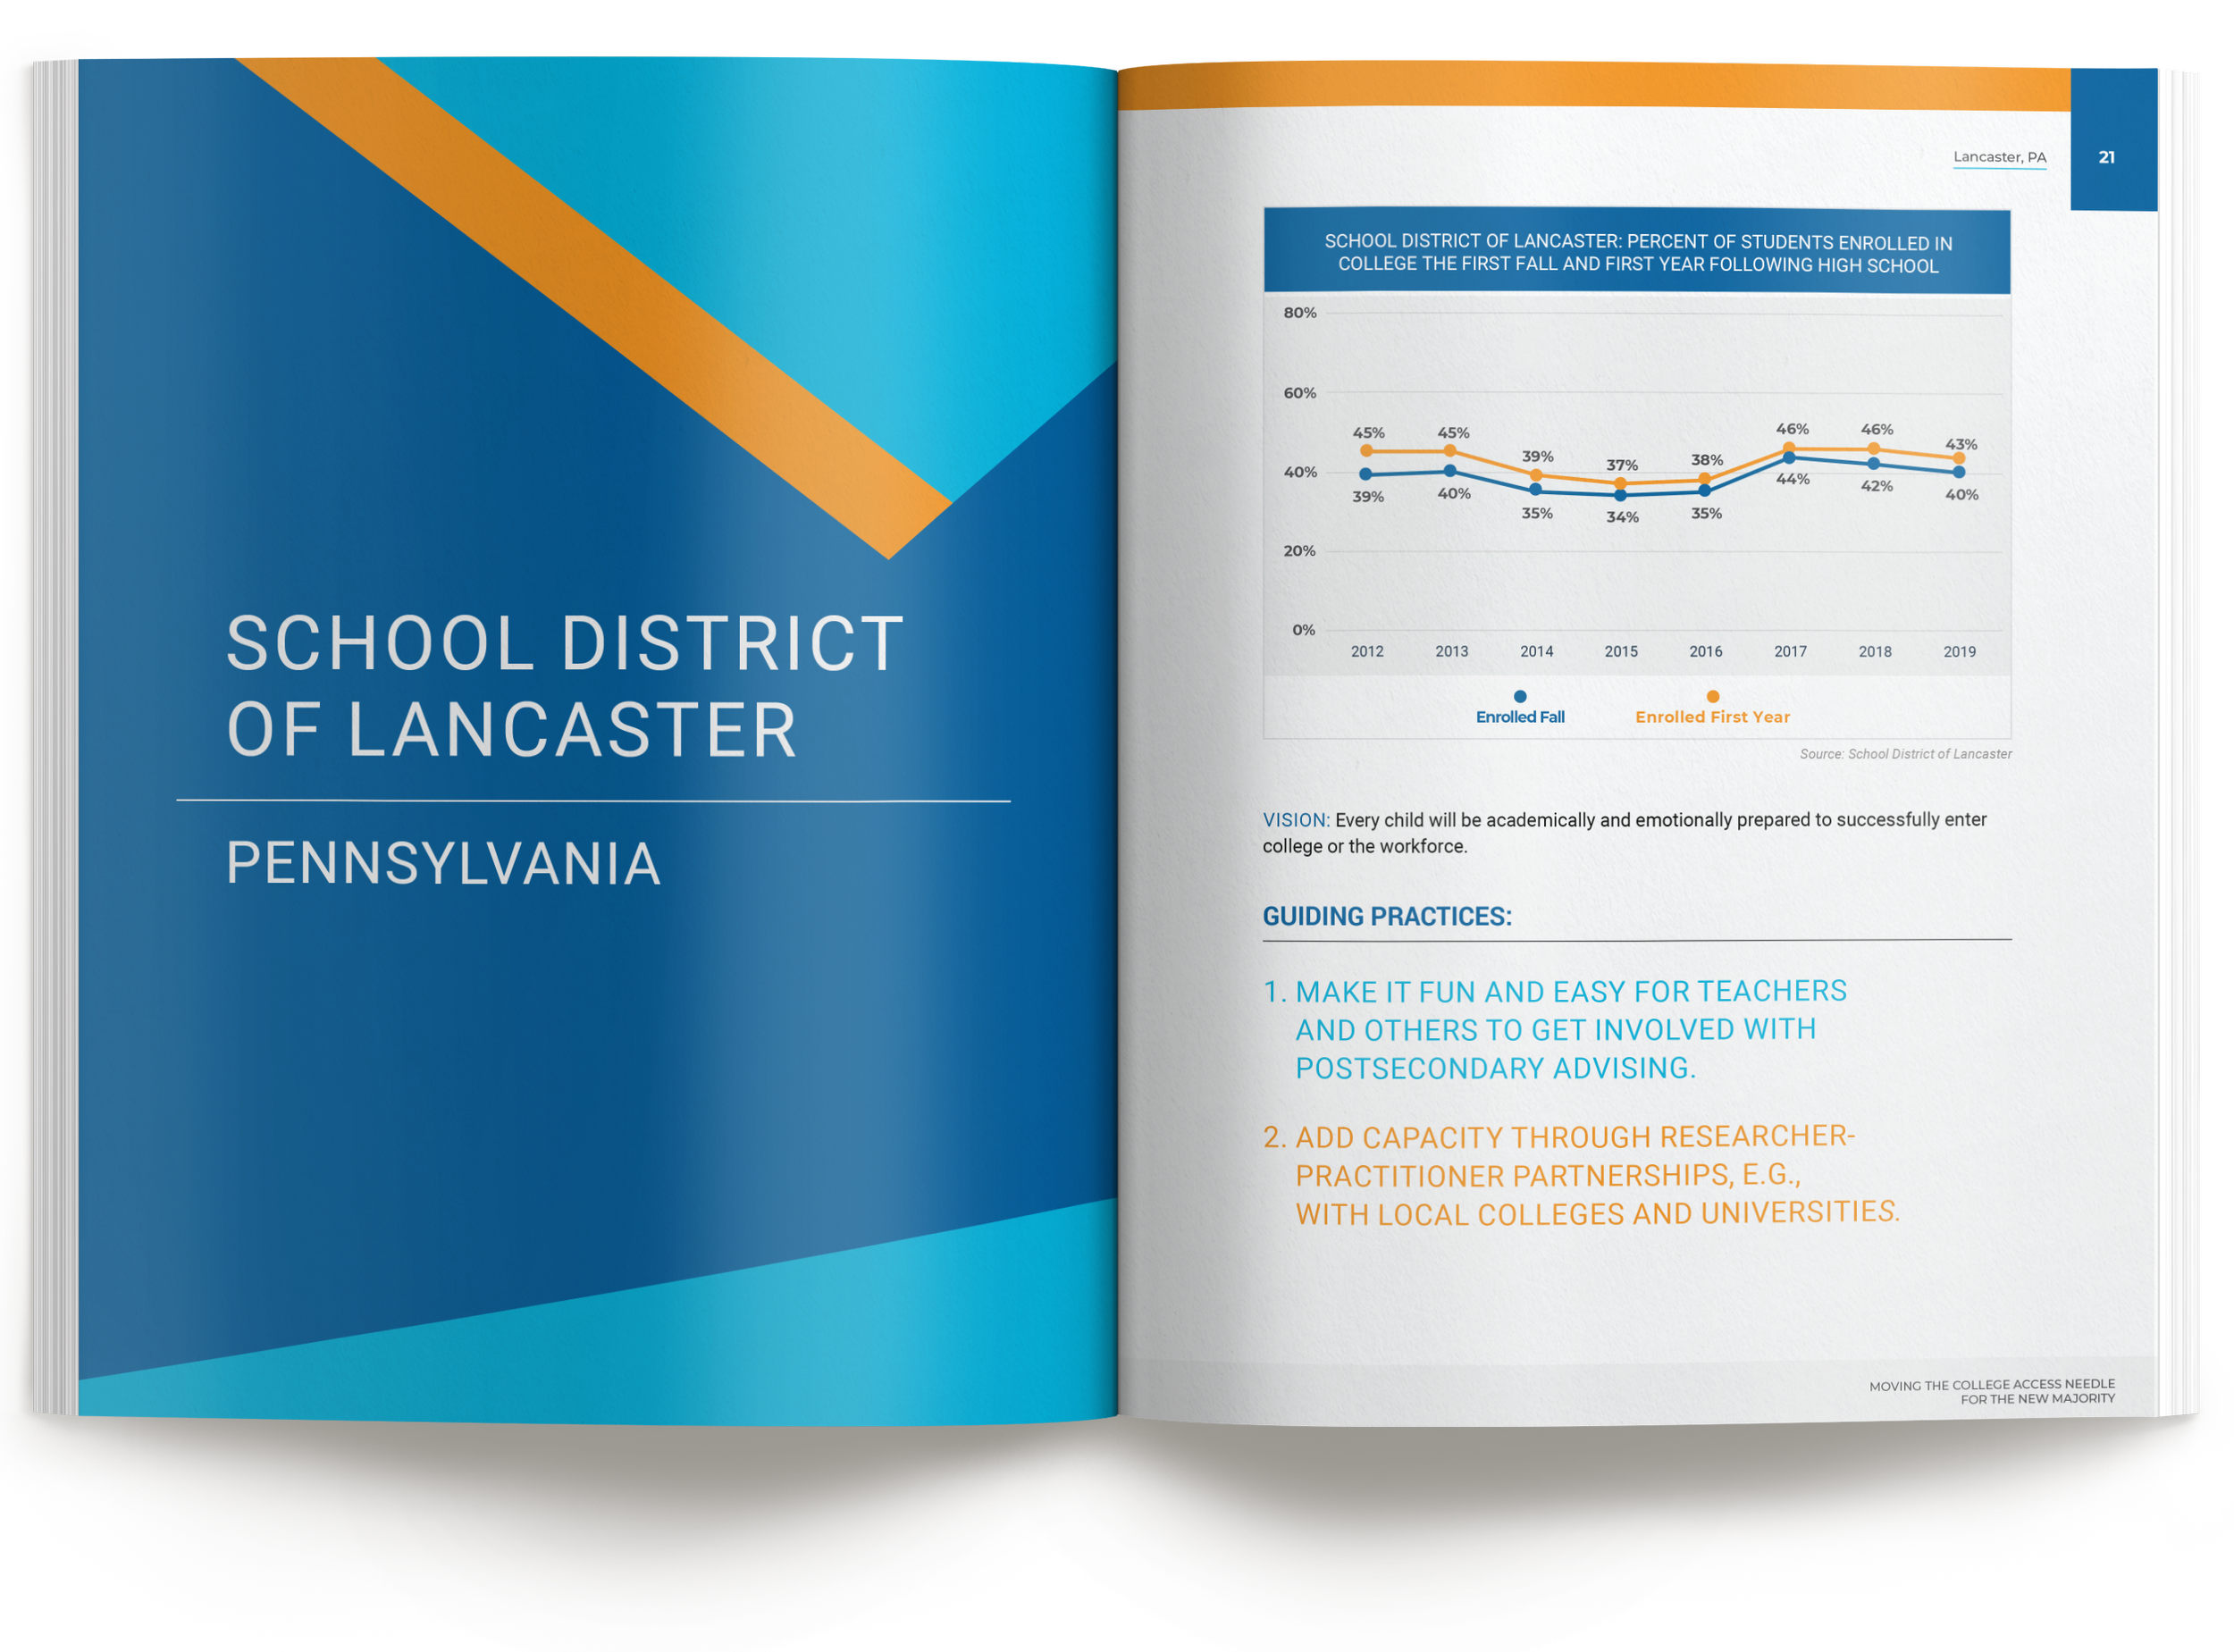
The chapter openers. Angled shapes pulled from the brand and run full bleed, so each district gets a clear start and the report's structure is legible at a flip.
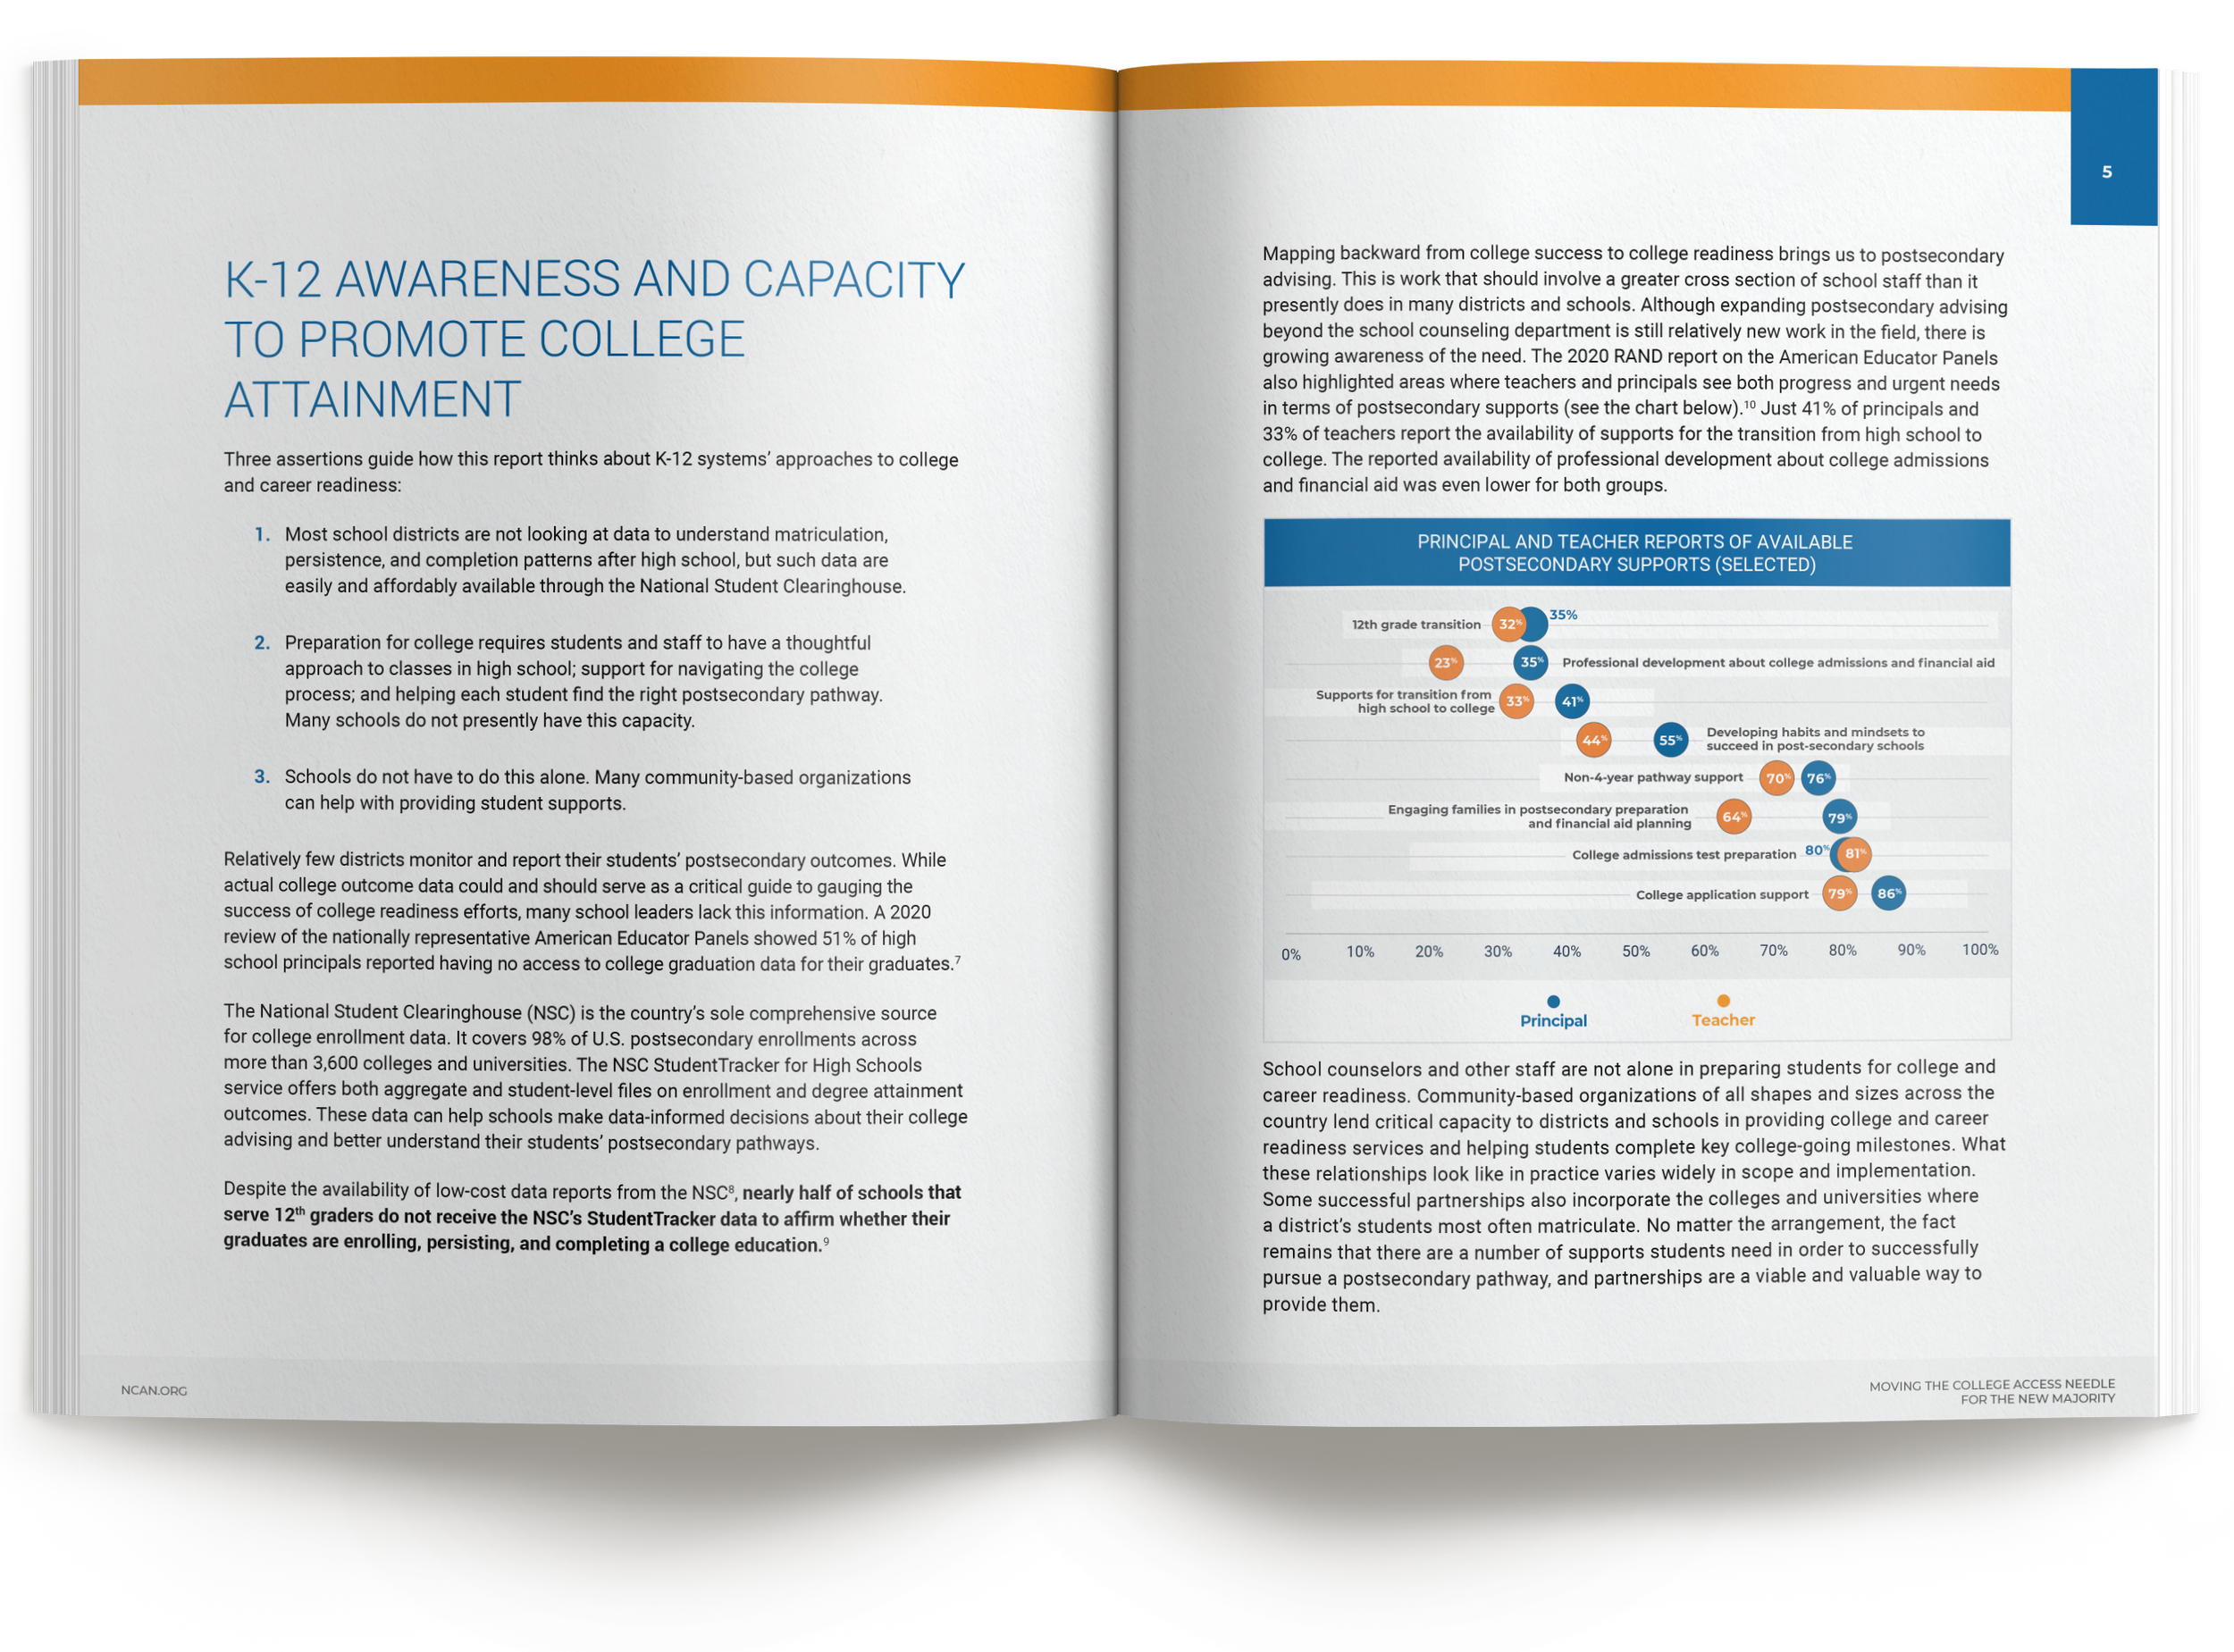
The rebuilt graphics. Excel in, Illustrator out: the same data, now legible, on-brand, and ready to travel as a social asset.
The interior pages. Color coding tells a reader which section they're in, and photography breaks up a dense read while holding the budget.

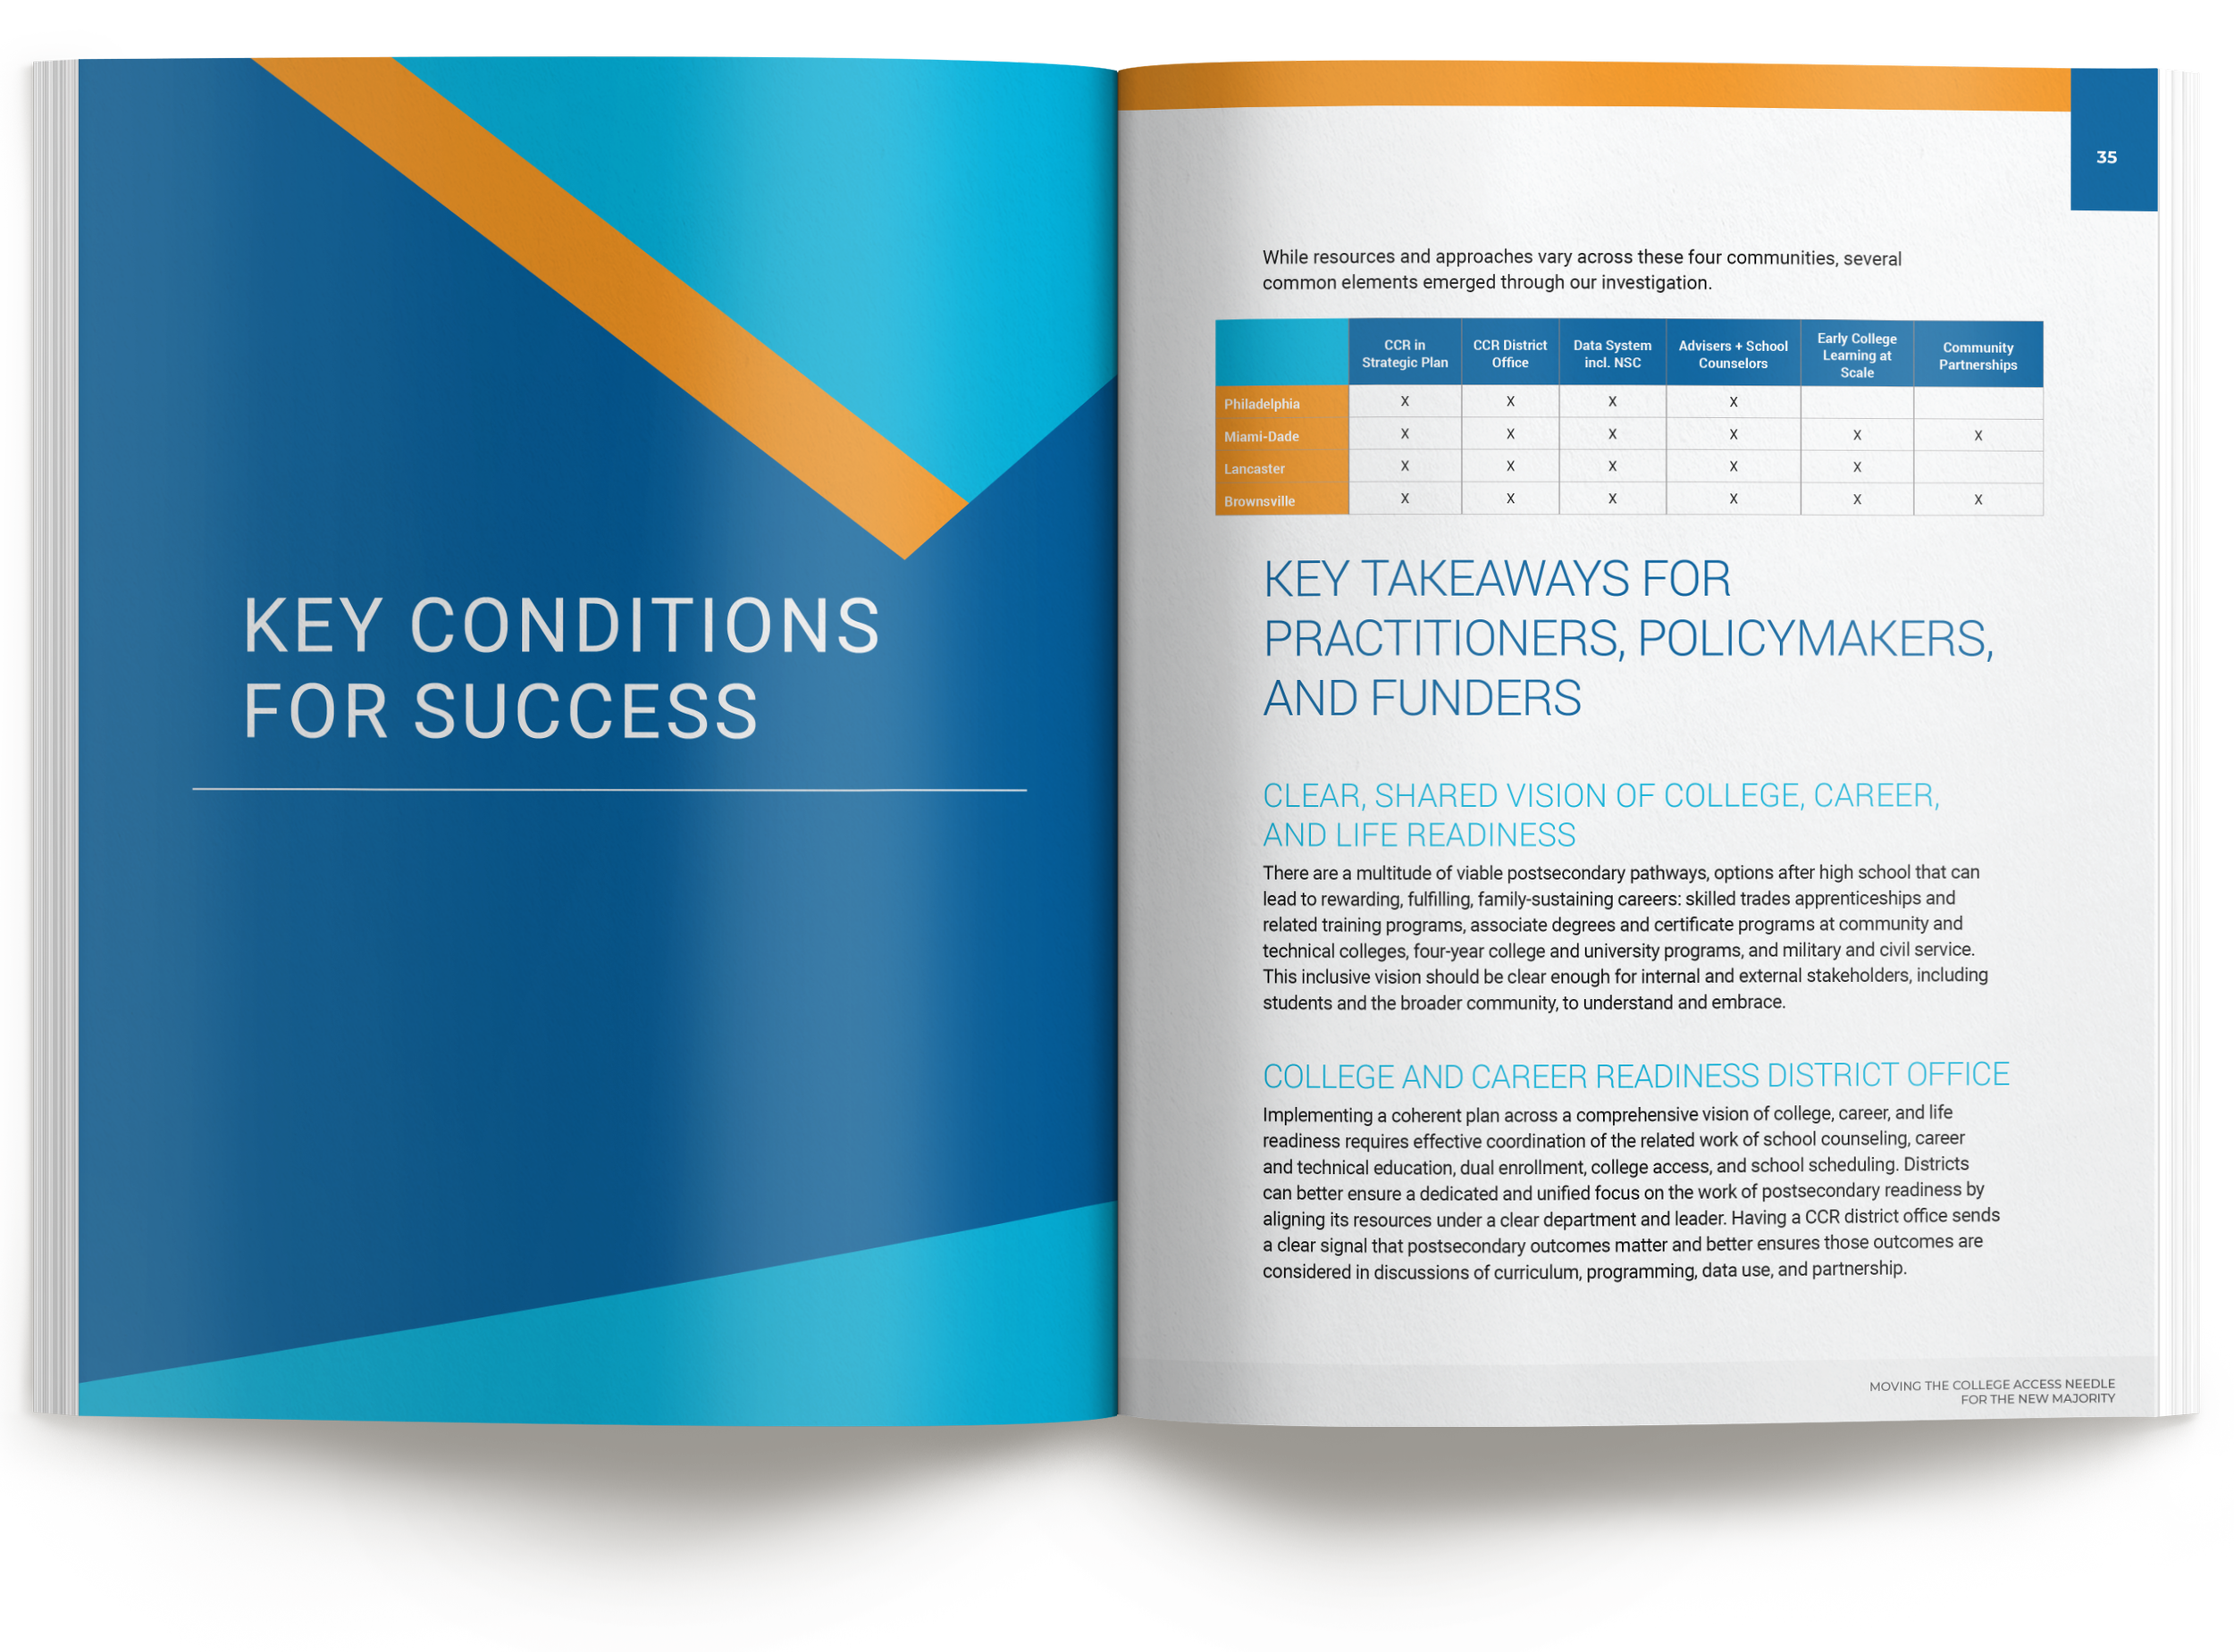
Key conditions. The opener system marking the closing section, paired with a four-district comparison table built to be read across at a glance.
Process note: The five graphics arrived as an Excel file, which meant the data was sound and the presentation wasn't. Rebuilding them in Illustrator was the obvious half. The less obvious half was sizing each one so it could be lifted straight out of the report and posted as a social asset without redrawing anything, which is why the rollout graphics cost nothing extra to produce.
How We Work With Research Teams
Most engagements begin with a manuscript: Word files, Excel charts, reviewer comments, and all. We build the page architecture around your content's structure, redraw figures from your data or from exported charts as publication-quality graphics in your brand, and manage edits with rounds against a tracked-changes PDF so feedback from multiple reviewers lands cleanly. Twenty years in the print industry and thousands of pieces sent to press stand behind every job. We speak your printer's language, spec the job so it prints the way it was designed, and manage estimates, proofs, and press checks through delivery, holding costs on budgets large and small. Fixed launch dates are treated as fixed.

“Our organization has worked with Karen for years due to her competitive pricing, expertise, and above all, pure creative talent. I have been thoroughly impressed and pleased with her work, especially her ability to transform a series of ideas and thoughts into something visually appealing and functional. She has become our “go-to” contractor of sorts and is always at the top of our list whenever we have a new project that requires a graphic designer.”
Planning a report like this?
Thirty minutes, no obligations. We'll talk about scope, timeline, and what your content needs to land.